Profiling
This document provides a cookbook on how to collect, process and analyze OMPC traces.
Collecting a trace
The OmpCluster runtime has built-in support for collecting execution traces in the JSON format. To enable it, simply export the following environment variable:
export OMPCLUSTER_PROFILE="/path/to/file_prefix"
A task graph in a DOT format also can be generated by exporting the environment variable:
export OMPCLUSTER_TASK_GRAPH_DUMP_PATH="/path/to/graph_file_prefix"
and then run your application normally. At the end of the execution, the runtime will create a couple of timeline files named <file_prefix>_<process_name>.json and two graph files named <graph_file_prefix>_graph_<graph_number>.dot. You should see one JSON file for each MPI process. Analyzing the traces separately is cumbersome but the OMPCBench tool can help you with that.
Merge timelines
Clone and install the OMPCBench tool in your machine and then follow the steps in the README to install it in a virtualenv. After installing, you can merge the timeline of all the processes into one using the following command:
# Run the following command inside the virtualenv:
ompcbench merge --no-sync # (Optional) Synchronize timelines disabled. The clocks may differ between processes, so by default the timelines are synchronized.
                --developer # (Optional) Generate a timeline for runtime developers (with more information and no filters applied).
                --ompc-prefix /path/to/file_prefix # Specify the common prefix or directory of the timelines to merge.
                --ompt-prefix /path/to/file_prefix # (Optional) Specify the common prefix or directory of the OmpTracing timelines to merge.
                --output tracing.json # (Optional) Merged timeline name. If not passed, default name is tracing.json
The file tracing.json will be created and you can proceed to the next stage of inspection. If the task graph file is in the traces folder, the timeline will contain task dependencies and identifiers.
Tip: Run
ompcbench merge --helpfor explanations and more options.
Inspecting the trace
In order to view your trace in a proper timeline, you can navigate to the URL chrome://tracing in the Chrome Browser, click “Load” in the top-left corner and then open your merged timeline or just drag and drop the file into the window. You should now be seeing your application trace, including the runtime operations. An example timeline is presented below.
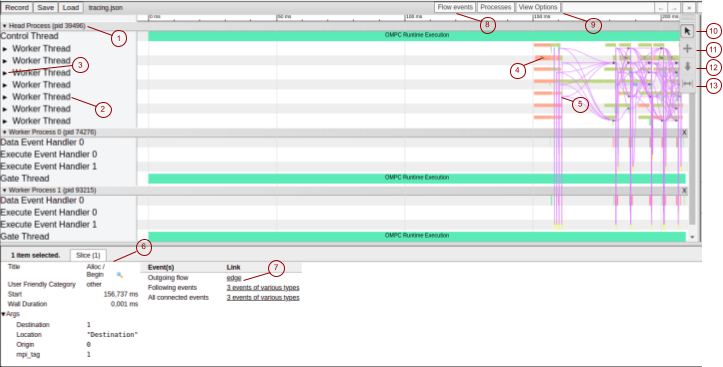 Timeline OMPC
The timeline points indicated by numbers represent as follows:
Process separation: all threads below belongs to the referenced process.
Thread separation: all events on the right belongs to the referenced thread.
Arrow to hide events: used to decrease the height of the timeline, as events from that thread are compressed vertically. It is useful when users need to analyze events that are vertically distant on the timeline. The arrow next to the process name has a similar function, but completely hides the threads and events of that process.
Timeline events: the label indicates what it represents on OMPC. All the colors are chosen by Chrome Tracing except for the events named “Task XX”, where events of the same color have the same source location and XX is the task id.
Arrows that indicate relations between different events.
Event information: when an event is selected, by clicking on it, this panel shows some event information. The first lines are information provided by the Chrome Tracing tool (as event start, duration, and arrows) and the args section is specific information about this event provided by OMPC.
Provides information about any arrow from or to this event. If click on it, it will show the two events linked.
If click on it, is possible to obtain a more clear view of the timeline by hiding the events arrows.
Used to search for events by label or any of its arguments.
Chrome Tracing tool to select events. This feature must be enabled to exhibit event info by clicking on it.
Chrome Tracing tool to move across the timeline. It is useful when the timeline is zoomed in to a specific point.
Chrome Tracing tool to zoom the timeline. It is useful to analyze events more precisely and see events that have a fine duration (like communication events). It is possible to zoom a specific event by pressing ‘f’ on the keyboard.
Chrome Tracing tool to measure the duration between two events on the timeline. It is useful when events are in a different process.
OMPC Events
The OMPC Events of the user version are listed below:
OMPC Runtime Execution: total duration of application.
Target Enter (Nowait): represents a target enter data map (nowait) region or an entrance in a target data map region (nowait).
Target Exit (Nowait)”: represents a target exit data map (nowait) region or an exit in a target data map region (nowait).
Target (Nowait): target (nowait) region, represents an execution task in the head node.
Execute / Target Execution or Task XX: total duration of task execution on worker nodes. If the graph file was provided, the name will be Task XX, where XX represents the task id, otherwise, the name will be “Execute / Target Execution”.
Execute: total duration of task execution on head node.
Alloc: when OMPC allocates data in the worker nodes. In the worker nodes this event is divided into a pair of Alloc / Begin and Alloc / End.
Submit: In the head node, represents a data submission to worker nodes. In the worker nodes, represent received data (from the head node through Submit event or from another worker through the Forward event) except in the developer version of the timeline (Forward events always have an associated Submit event representing a data submission). In the worker nodes, this event is divided into a pair of Submit / Begin and Submit / End.
Delete: the data allocated on the worker nodes are freed. In the worker nodes, this event is divided into a pair of Delete / Begin and Delete / End.
Retrieve: represents data received in the head node from a worker node. In the worker nodes, this event is divided into a pair of Retrieve / Begin and Retrieve / End.
Forward: represents the head node sending a message to a worker to send data to another worker. The worker node receives the data by the Submit event. In the worker nodes, this event is divided into a pair of Forward / Begin and Forward / End.
Variable names: if the user compiles the application with debug symbols, setting CMake flag to
-DCMAKE_BUILD_TYPE=RelWithDebInfo, events that have variable names associated (e.g. Submit) will be nested to a variable name event.
OMPC Args
Some of the arguments that can appear in OMPC events are listed below:
Origin: number of the process where the event was created.
Destination: number of the process where the event was executed.
Location: some events have a pair (origin and destination), the location indicates which of the pairs the event is on.
mpi_tag: event id that is the same for the origin and destination pair.
task_id: the identifier of the task that corresponds to the task graph.
source_location: the file, line, and collum that the event was executed. For the origin and destination args, the number represents the ids of head and worker nodes. 0 represents the head node, 1 represents the worker node 0, and so on.
OMPC Dependencies
The OMPC timeline has dependencies (arrows) that indicate relations between different events. These dependencies can be disabled to clear the timeline view, and the names presented in the image below represents:
![]() Timeline Dependencies
Timeline Dependencies
Communication: dependencies between event communication pairs (Begin and End) in the worker nodes.
Tasks: data dependencies between tasks in the head nodes.
Worker Process X: dependencies between Execute event in the Head node and Task events in the worker node X, where X is the id of the worker node.
OMPC Threads
Head Node:
Control Thread: responsible for scheduling the task graph. Worker Thread: responsible for data communication and task creation.
Worker Node:
Data Event Handler: handles data communication events (receiving and submitting data).
Execute Event Handler: handle the execution of tasks.
Filter usage
The Filter command is similar to the merge command, but with fewer options. You can pass an OMPC prefix and it will merge and automatically filter and synchronize the files. The advantage of using the filter is when the user already has a merged timeline in a developer version and needs to simplify it.
# Run the following command inside the virtualenv:
ompcbench filter --ompc-prefix /path/to/file_prefix # Specify the common prefix or directory of the timelines to merge.
                --output tracing.json # (Optional) Merged timeline name. If not passed, default name is tracing.json
OmpTracing usage
OmpTracing tool extract information about the OpenMP runtime like the duration of loops, parallel regions, and tasks. The OMPC timeline collects only information about tasks created using the target compile directive, while OmpTracing provides information about the ones created using the task compile directive. OmpTracing can be used just by executing the following command, and merged with OMPC timeline by using ompt-prefix merge option:
export OMP_TOOL_LIBRARIES=/path/to/libomptracing.so
For more information about how to select events to be monitored, consult this documentation.