OmpTracing
This tool can be used to trace the execution of an OpenMP (or OmpCluster) application.
Usage
To enable OmpTracing you just need to set the OMP_TOOL_LIBRARIES environment
variable to the path of the OmpTracing library.
export OMP_TOOL_LIBRARIES=/path/to/libomptracing.so
./your-own-omp-program
If you use one of the container images provided by OmpCluster, OmpTracing
library is already provided in /opt/omptracing/lib/libomptracing.so, otherwise
you can compile it from its repository.
After the execution of the program ends, OmpTracing should have produced two files: a JSON file containing the tracing of the execution and a DOT file describing the task graph produced by the OpenMP runtime.
Tracing
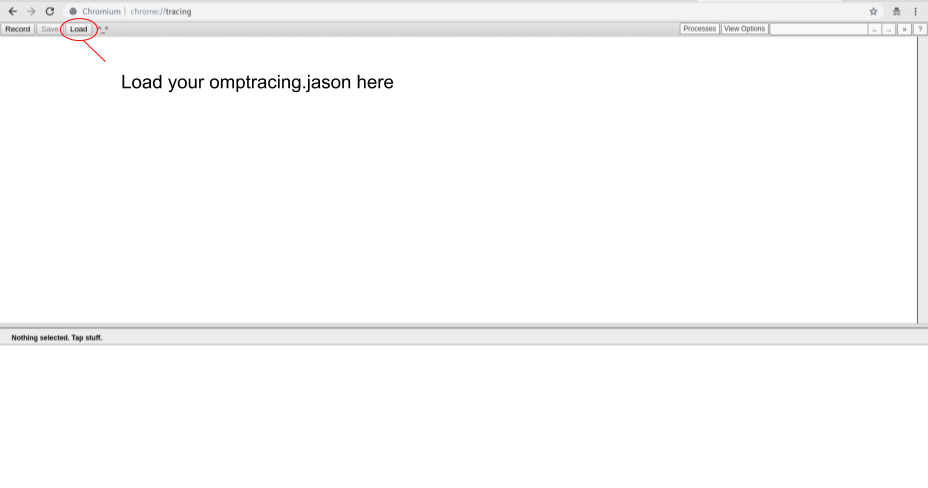
You can use Chrome browser as an graphical interface to see the tracing of the
program execution. Just open Chrome (or Chromium), enter chrome://tracing in
the address field. A new interface should appear where you can load the
omptracing.json file just as presented in the image below.
 tracing
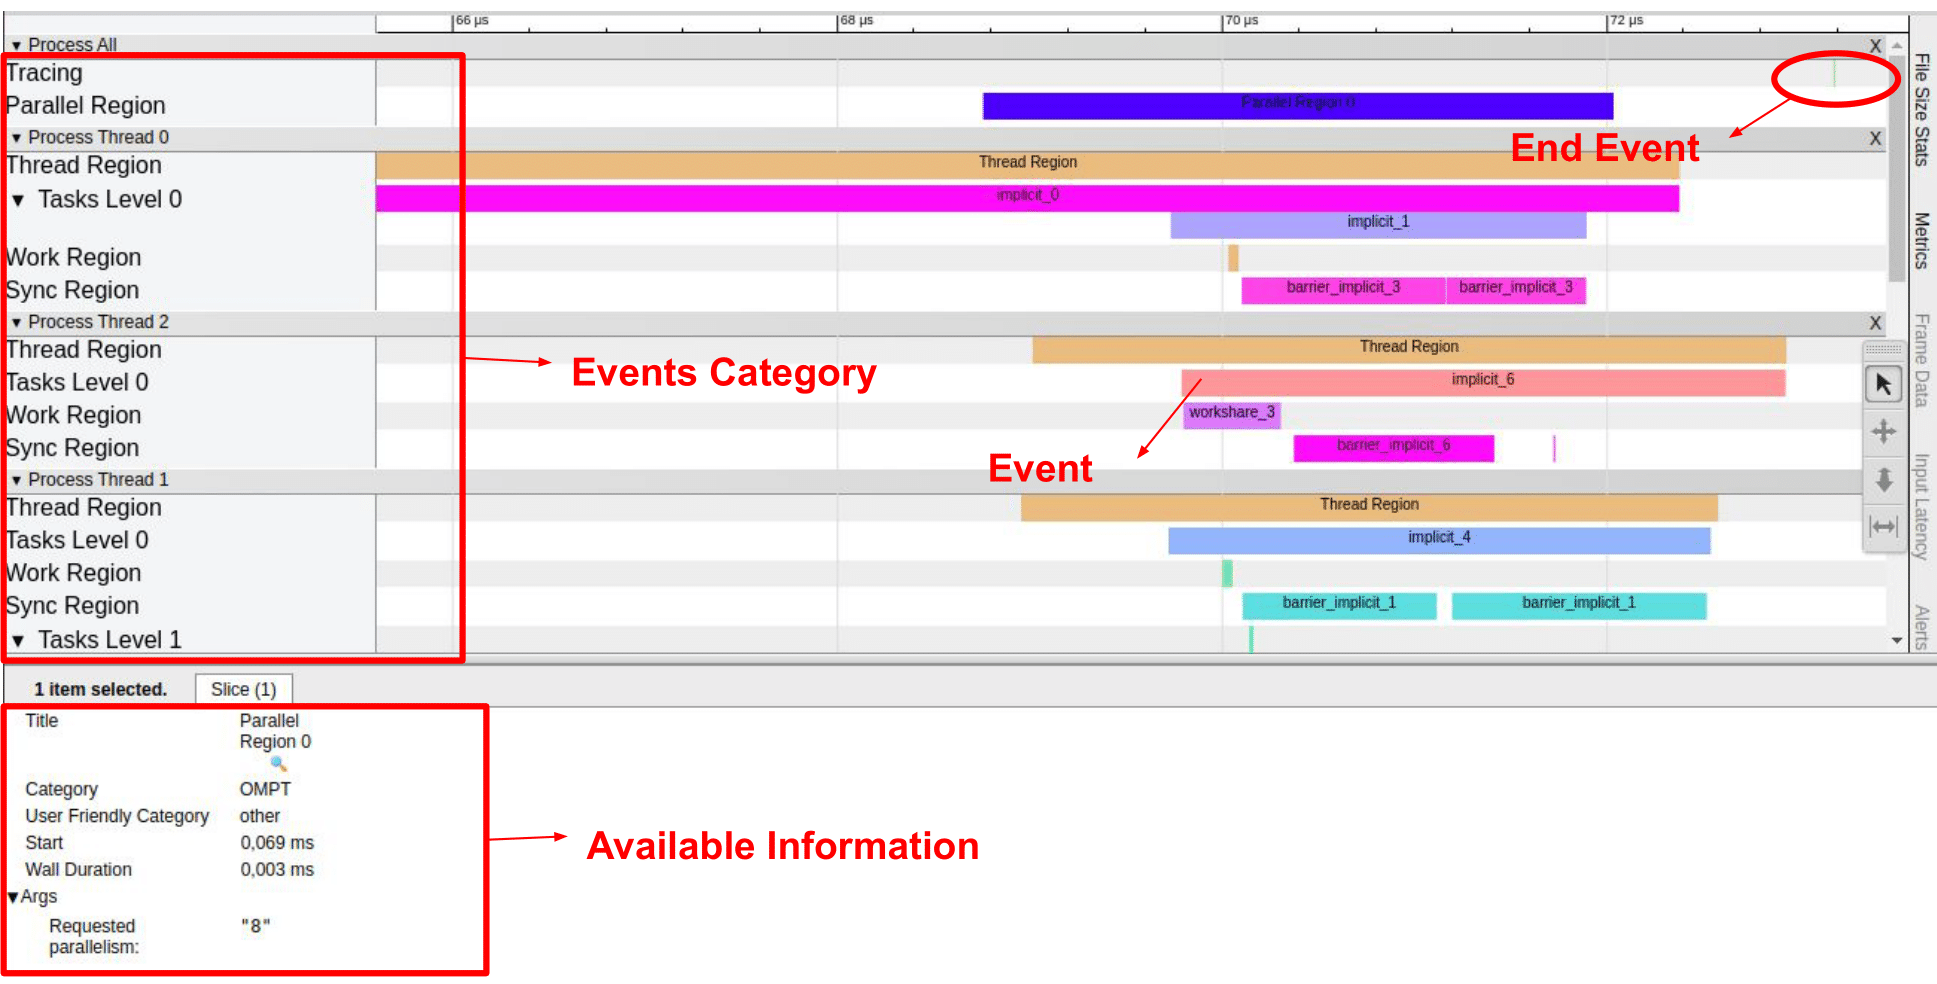
A timeline example is presented in the image below. An OmpTracing timeline displays events, categories (that separate events), and extra information about a selected event. The registered events are the horizontal colored bars (e.g. the implicit_6 event indicated), the left panel separates the events by their categories such as parallel region, thread region, and others. Each event has its category or subcategory id that composes the event name, for example, the implicit_6 event indicated has Tasks Level 0 category (left panel) and implicit subcategory with 6 id (event name). The number in the task level category on the left panel represents the level of the task parent tree. When an event is selected, all the available information (args) is presented in the bottom section. The selection of a specific event can be performed by clicking on the event’s bar on the timeline. The categories are divided by threads (Process Thread in the left panel) and the general categories are aligned in Process All. The tracing category registers the beginning and the end of the application. In the figure, the begin event is hidden because of the image zoom, and the end event is circled.
 timeline
The categories are explained below.
Parallel Region: it marks the begin and the end of parallel regions. Each region specifies an ID and the number of threads requested.
Thread Region: it marks the begin and the end of thread regions. The thread type is specified. See OMPT documentation to get more informations.
Tasks: it marks the begin and the end of tasks. The tasks are divided in levels. A parent task is a task that created another one, and tasks of level zero have no parent tasks. The level information is described in the label section, as well as the parent task id and the task type. See OMPT documentation to get more informations.
Work Region: it marks the begin and the end of work regions like loop, taskloop, sections, workshare, single regions and distribute regions and gave information about it. See OMPT documentation to get more informations.
Implicit Task Region: it marks the begin and the end of implicit task regions and gave your number of threads/teams. See OMPT documentation to get more informations.
Master Region: it marks the begin and the end of master regions. See OMPT documentation to get more informations.
Sync Region: it marks the begin and the end of sync regions like barrier implicit/explicit, taskwait, taskgroup and reduction. See OMPT documentation to get more informations.
Task Graph
OmpTracing also produce a dot file representing the task-dependency graph of the OpenMP program. You can produce a PDF file to visualize it using the following command:
dot -Tpdf graph.gv > graph.pdf
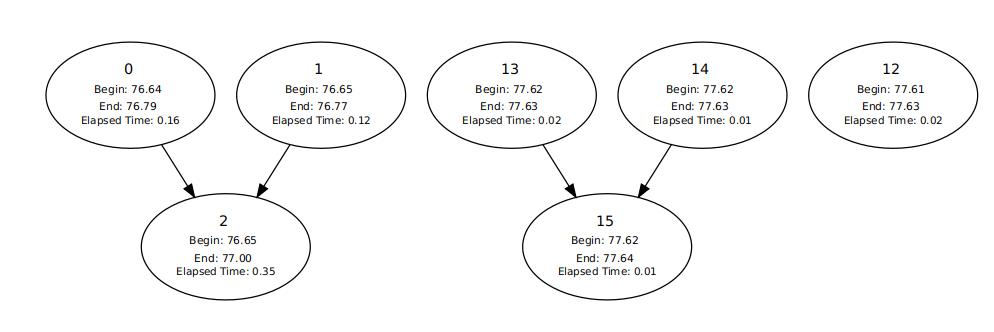
A graph example is presented in the image below. The graph shows the tasks labeled with OmpTracing identifier numbers and the dependencies are represented by arrows. Each task contains your specific begin time, end time, and elapsed time.
 timeline
Configuration
OmpTracing permits to configure which information will be present in the timeline by passing a JSON configuration file like the model below. An updated example is available here in the OmpTracing repository. The monitored events array select which events will be tracing, the max tasks field represents the maximum number of tasks supported, the critical path field indicates if the critical path will be highlighted in the graph generated (the blue path in the graph example below), and the graph time field indicates if the time information will be presented in the graph. Just add or remove some events to the monitored events array to add or remove the tracing of this information.
{
  "monitored events": [
    "task",
    "task create",
    "thread",
    "parallel",
    "work",
    "implicit task",
    "master",
    "sync region",
    "taskwait"
  ],
  "max tasks":2048,
  "graph time":"yes",
  "critical path":"yes"
}
 tracing
OmpTracing registers only those events defined in the config selector file or uses a default selection. There are two ways to pass a config selector file to OmpTracing:
By assigning the file path to
OMPTRACING_CONFIG_PATHenvironment variable;By placing the file with the name ”config.json” in the same folder as the application.
If OmpTracing can not read the file passed, it will use the default config selection.
Tagging
OmpTracing allows adding tagging on the parallel code by adding omptracing
header (omptracing.h) and find omptracing package on CMake. The functions
omptracingTagBegin and omptracingTagEnd permit you to choose the name
category (tag name) and the event name while the functions
omptracingTagEventBegin and omptracingTagEventEnd permit you to choose just
the event name and use a default OmpTracing tag name. See the example code
below.
  #include "omptracing.h"

  ...

  // Tag Name: Default
  // Event Name: first_computation
  omptracingTagEventBegin("first_computation");
  ...
  omptracingTagEventEnd("first_computation");

  // Tag Name: Example
  // Event Name: second_computation
  omptracingTagBegin("Example", "second_computation");
  ...
  omptracingTagEnd("Example", "second_computation");
The timeline generated is present in the image below.
 tracing
A more practical example is present in the next image. It shows a spotrf core tagging of Plasma application. The marked tags are in the “Example” category and it shows spotrf, strsm, ssyrk, and sgemm Plasma computation.
 tracing
Linking to OmpTracing library
Contrary to the timeline and the taskgraph which are activated through OMPT environment variable, tagging requires to link the OmpTracing library in a more tradiditionnal manner. This can be achieved using for example the following CMake code:
find_package(omptracing CONFIG REQUIRED)
include_directories(${omptracing_INCLUDE_DIRS})

...

target_link_libraries(mytarget omptracing)